Root gene expression profile covering various developmental stages and tissue-types
FeatureNum 6721 Expression Data
Locus ID
FeatureNum
Accession
Description
Os02g0105300
6721
AK106891
Similar to L-lactate dehydrogenase (EC 1.1.1.27) (LDH).
How to read graphs
Change to scroll mode
View plot data
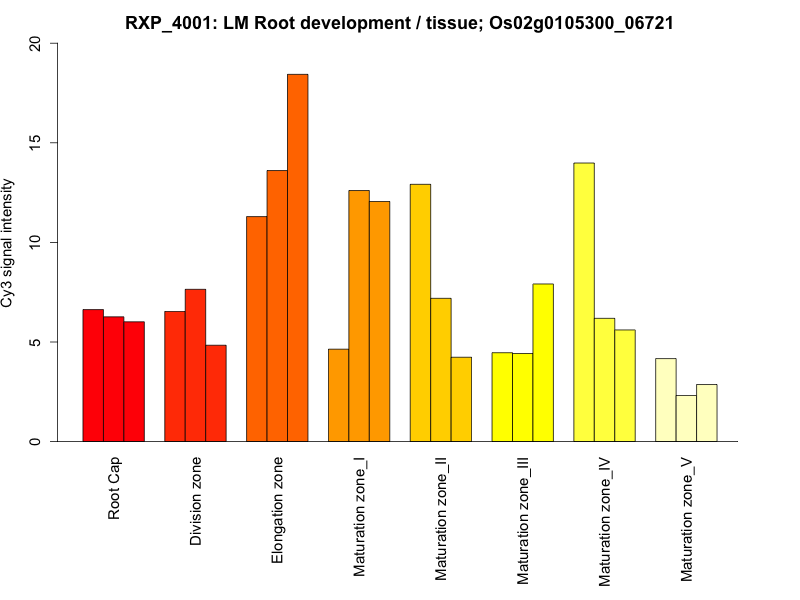
Raw Signal Intensity Bar Graph
Normalized Signal Intensity Line Graph
Raw Signal Intensity Pictograph
Relative Expression Value Pictograph
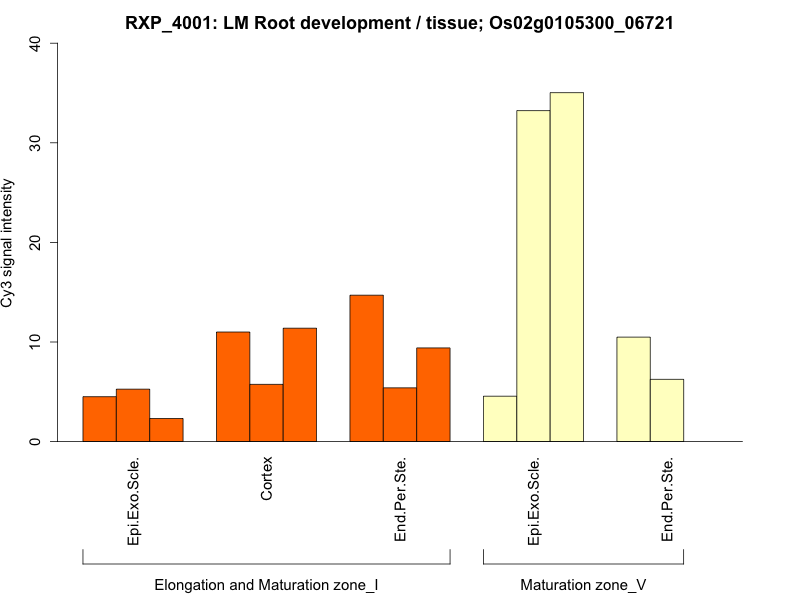
Raw Signal Intensity Bar Graph
Development
Tissue-type
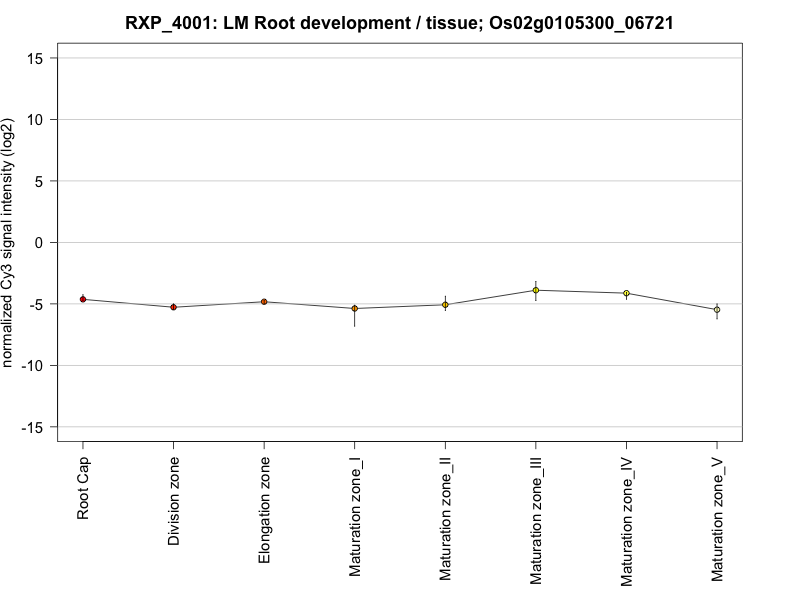
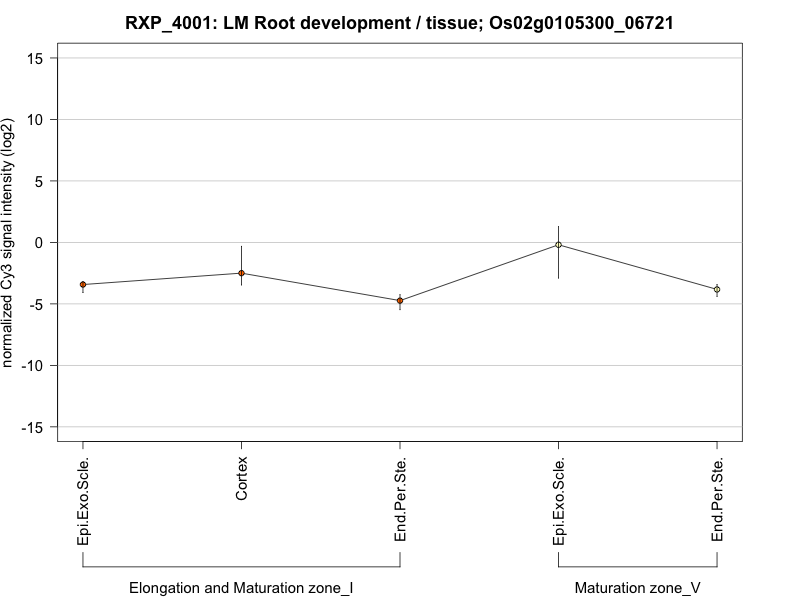
Normalized Signal Intensity Line Graph
Development
[change Y-scale of lineplot]
Tissue-type
[change Y-scale of lineplot]
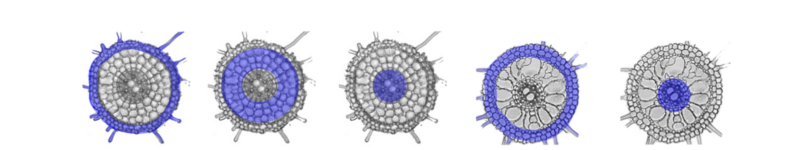
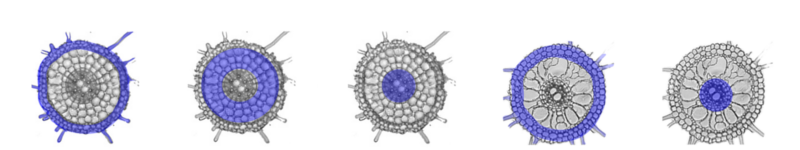
Raw Signal Intensity Pictograph
Development
Tissue-type
Relative Expression Value Pictograph
Color Scale
5/-5 expression value
Max/Min expression value
Development
Tissue-type
Caution!
Extremely low signal intensity!
For this gene, the raw signal intensity (median of replicates) for all samples is below 50.
 How to read graphs
How to read graphs
How to read graphs
 Change to scroll mode
 View plot data